
In the fast-paced world of finance, visual elements have become indispensable tools for investors and businesses seeking to interpret complex data and predict market trends. The ability to visualize information effectively can transform raw numbers into actionable insights. Whether analyzing stock performance, forecasting economic shifts, or identifying investment opportunities, charts, graphs, and infographics play a crucial role in decision-making This guide explores how businesses can leverage visual elements to predict market trends, enhance investment strategies, and communicate financial insights with clarity and precision.
The Power of Visual Elements in Investment Analysis

Understanding the Role of Visual Elements
Visual elements simplify complex financial data, making it easier to identify patterns, correlations, and anomalies. In investment analysis, these elements bridge the gap between data and decision-making. Instead of sifting through spreadsheets filled with numbers, investors can rely on visual elements to highlight key metrics and trends at a glance.
This is similar to the power of data analytics in digital marketing, where businesses use visual data to understand performance and make smarter decisions.
For example, a line chart showing stock price movements over time can instantly reveal volatility, growth, or decline. Similarly, a heat map can illustrate sector performance, helping investors pinpoint which industries are flourishing. By integrating these tools into financial analysis, businesses can make data-driven decisions faster and with greater confidence.
Why Businesses Need Visual Elements
Businesses rely on visual elements to communicate insights across departments. Financial analysts, marketing teams, and executives all benefit from clear visualizations that translate data into stories. In investment contexts, data visualizations help stakeholders understand market dynamics, assess risk, and forecast returns. For new businesses, a strong visual identity is key to building credibility and standing out in a competitive market. These tools also improve transparency, enabling investors to see how external forces like inflation, interest-rate shifts, or geopolitical developments influence market outcomes.
The Science Behind Visual Elements and Market Prediction

1. Cognitive Benefits of Visual Elements
Visual information is processed by the human brain far more rapidly than text about 60,000 times faster. This cognitive advantage makes data visualization essential for interpreting financial data efficiently. When investors view a chart, their brains can quickly detect upward or downward trends, identify outliers, and recognize cyclical patterns. This rapid comprehension enables faster decision-making, which is critical in volatile markets.
2. Data Visualization and Predictive Analytics
Predictive analytics relies heavily on charts and graphs to display forecasts and probabilities. Machine learning models generate vast amounts of data, and tools like regression plots, scatter diagrams, and time-series charts help interpret these outputs. Businesses can use these visuals to anticipate market movements, identify leading indicators, and adjust investment portfolios accordingly.
3. Pattern Recognition and Behavioral Insights
Charts and heat maps enhance pattern recognition by allowing investors to identify recurring behaviors in market data. Charts and heat maps reveal correlations between variables such as volume, volatility, and sentiment. Recognizing these patterns helps investors understand behavioral trends, such as herd mentality or momentum trading, which influence market direction.
4. Emotional and Psychological Impact of Visuals
Colors, shapes, and motion in charts can evoke emotional responses that influence decision-making. For instance, green tones often signal growth and stability, while red tones indicate caution or decline. Grasping these psychological effects lets businesses craft visualizations that convey insights transparently and without distortion.
5. Integration of Neuroscience and Data Interpretation
Recent advances in neuroscience show that data visualizations activate multiple areas of the brain simultaneously, improving memory retention and analytical reasoning. When complex data is presented visually, investors engage both logical and intuitive thinking processes. Integrating these tools improves comprehension, supporting more precise forecasts and strategic investment choices.
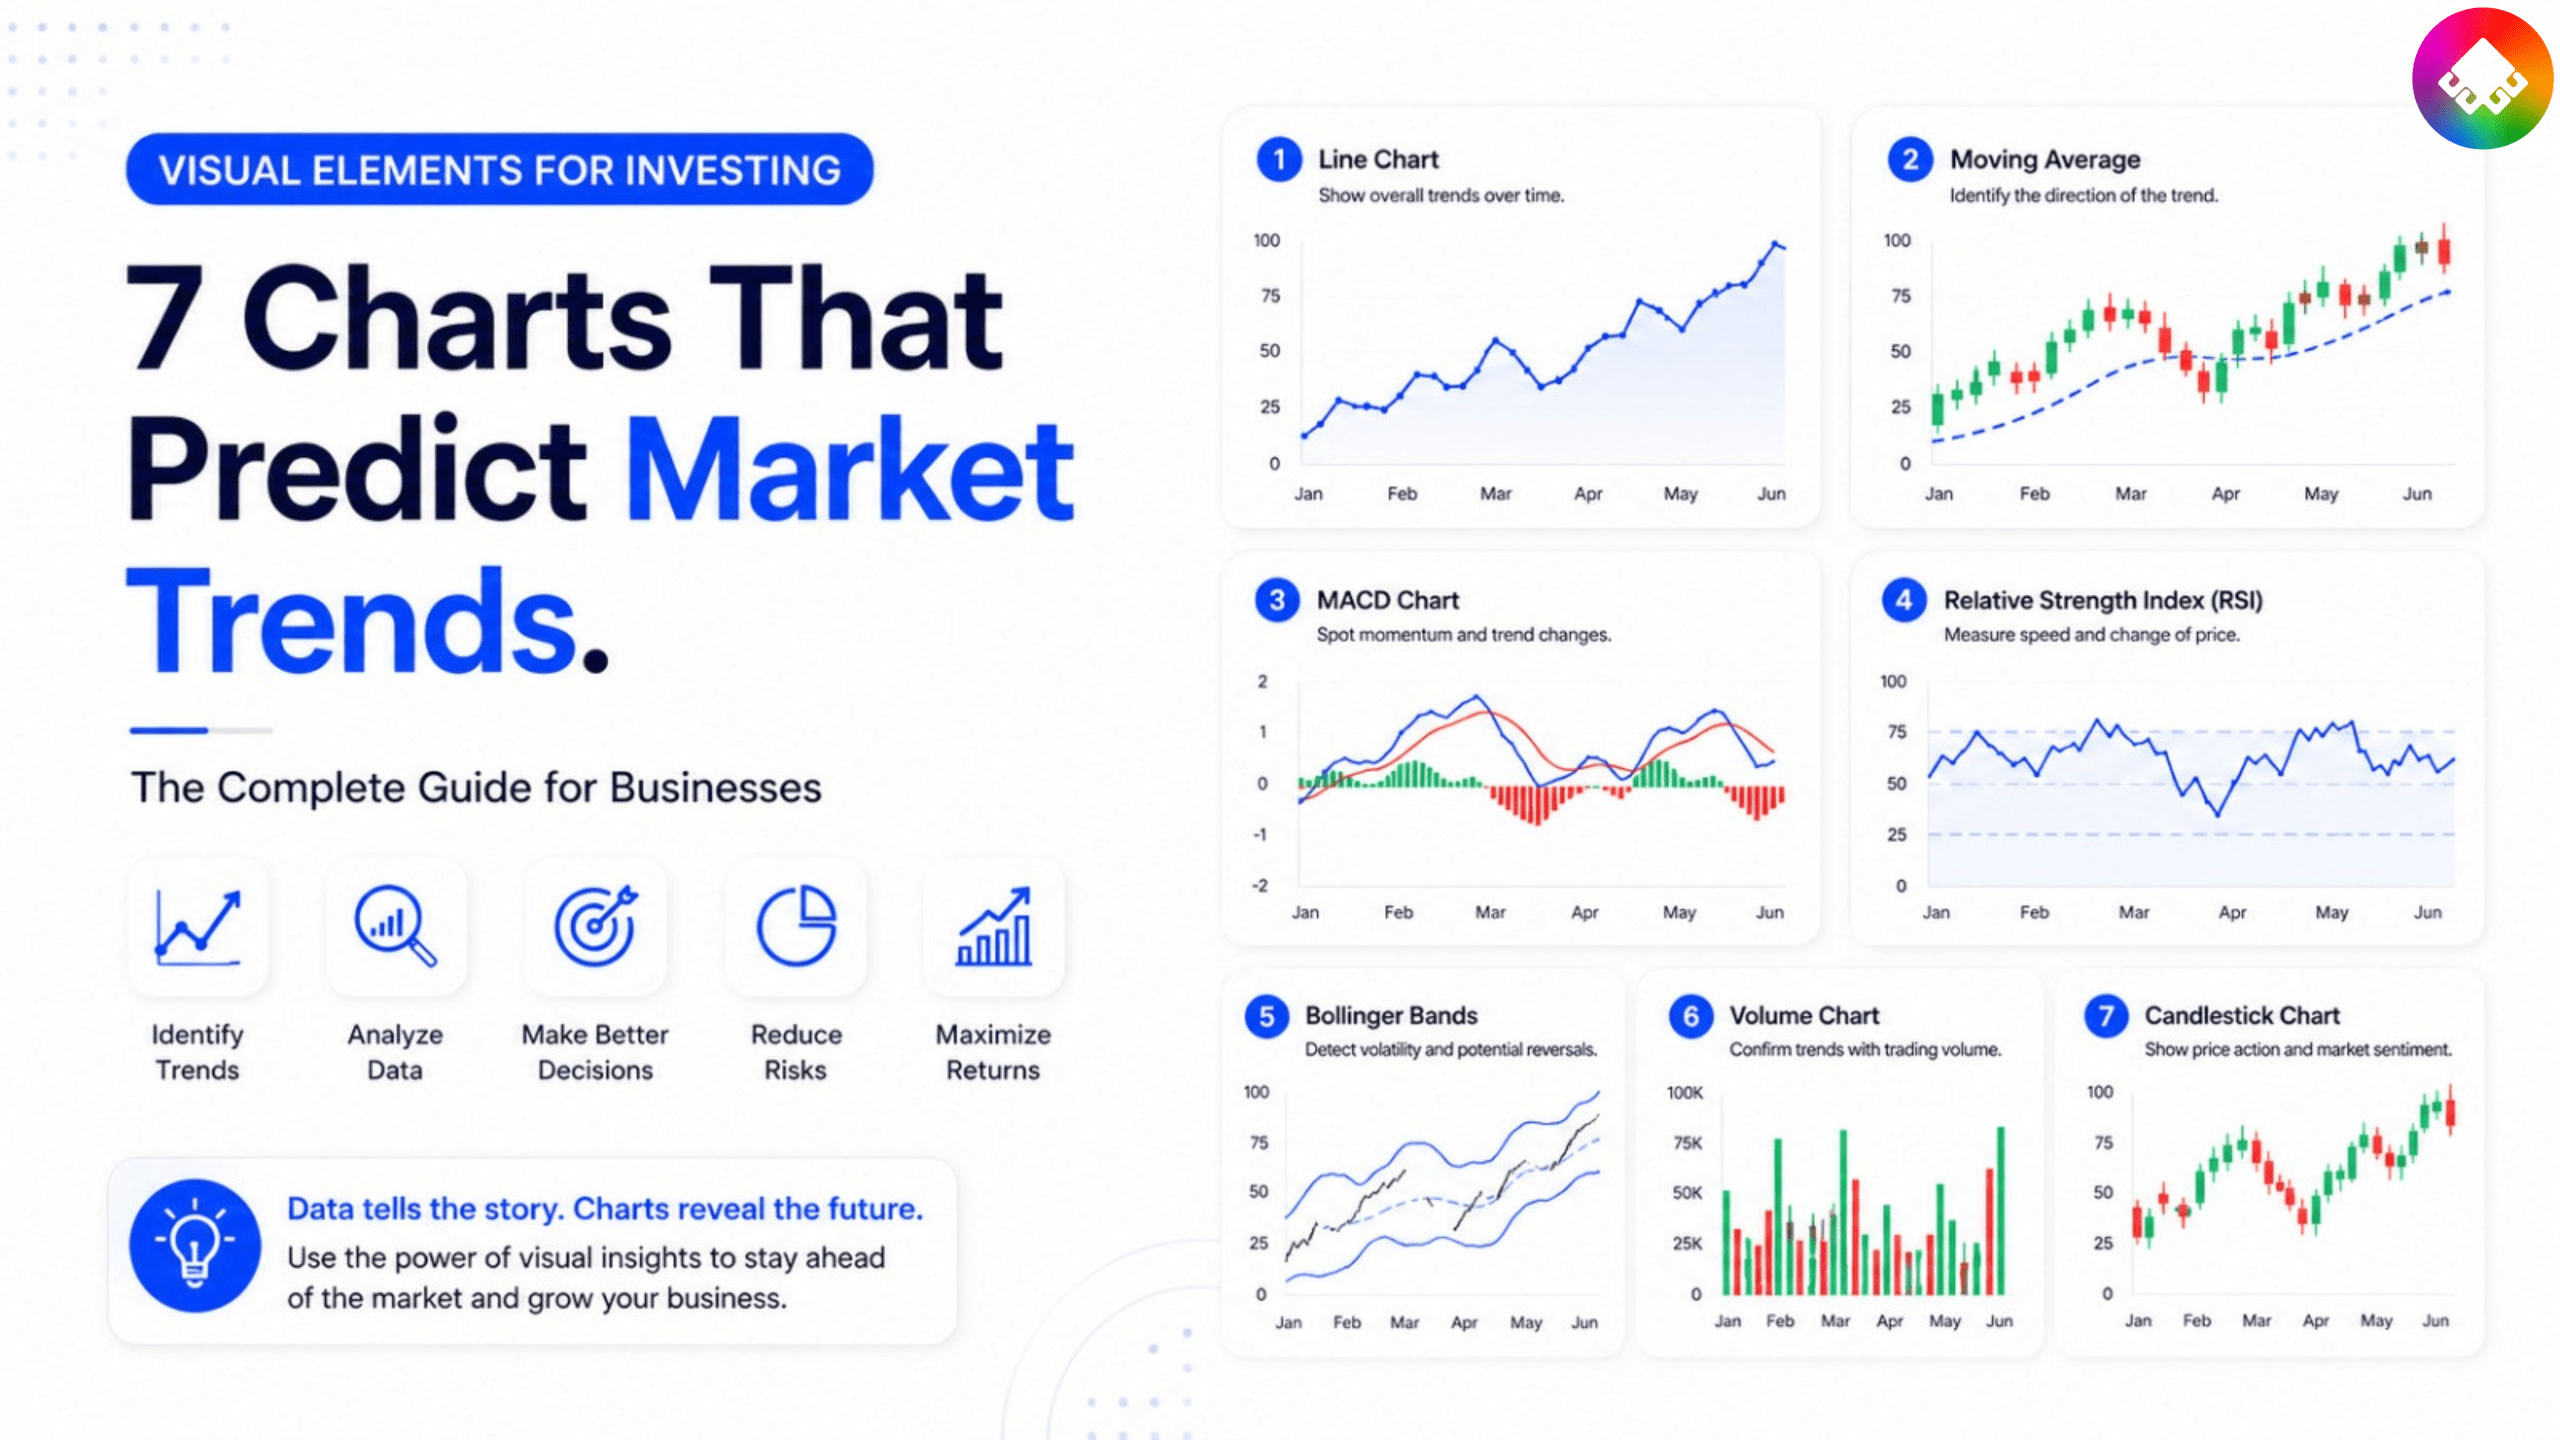
The 7 Essential Charts That Predict Market Trends

1. Line Charts: Tracking Price Movements Over Time
Line charts are among the most fundamental tools in investment analysis. They display price changes over time, allowing investors to observe trends, cycles, and volatility. A well-designed line chart can reveal whether a stock or index is in an uptrend, downtrend, or consolidation phase.
Businesses use line charts to:
- Monitor stock performance
- Compare multiple assets
- Identify support and resistance levels
By integrating features like color gradients and moving averages, line charts become powerful tools for predicting future price movements.
2. Candlestick Charts: Understanding Market Sentiment
Candlestick charts are dynamic tools that show price action within specific time frames. Each candlestick represents the opening, closing, high, and low prices, providing insights into market sentiment. Bullish and bearish patterns, such as “doji” or “hammer,” help traders anticipate reversals or continuations.
Candlestick charts show how investors react in the market, similar to how Social Media Engagement Tips to Build a Loyal Audience help businesses understand audience behavior online.
Businesses and investors rely on candlestick charts to:
- Detect momentum shifts
- Identify entry and exit points
- Analyze investor psychology
These charts combine technical precision with intuitive readability, making them indispensable for short-term trading strategies.
3. Bar Charts: Comparing Performance Across Assets
Bar charts are versatile tools used to compare performance across multiple assets, sectors, or time periods. They are particularly useful for portfolio analysis, where investors need to evaluate returns, risk exposure, or diversification.
Applications of bar charts include:
- Comparing quarterly earnings
- Assessing sector performance
- Visualizing portfolio allocation
By using color-coded bars and consistent scaling, businesses can ensure that these charts communicate insights clearly and accurately.
4. Scatter Plots: Revealing Correlations and Relationships
Scatter plots are analytical tools that display relationships between two variables. In investment analysis, they can reveal correlations between factors such as interest rates and stock prices or inflation and commodity performance.
Key uses of scatter plots:
- Identifying positive or negative correlations
- Detecting outliers
- Supporting regression analysis
These charts help businesses uncover hidden relationships that might influence investment outcomes.
5. Heat Maps: Visualizing Market Strength and Weakness
Heat maps are powerful tools that use color intensity to represent data magnitude. In financial markets, they provide a snapshot of performance across sectors, indices, or asset classes. A green-to-red gradient can instantly show which areas are gaining or losing value.
Benefits of heat map:
- Quick identification of market leaders and laggards
- Sector rotation analysis
- Portfolio rebalancing insights
Businesses use these visual elements to make strategic decisions based on real-time market conditions.
6. Moving Average Charts: Smoothing Out Volatility
Moving average charts are predictive tools that help investors identify long-term trends by smoothing out short-term fluctuations. They are essential for determining trend direction and potential reversal points.
Common types of moving average:
- Simple Moving Average (SMA)
- Exponential Moving Average (EMA)
- Weighted Moving Average (WMA)
By overlaying these on price charts, businesses can confirm trend strength and make informed investment decisions.
7. Volume Charts: Measuring Market Participation
Volume charts are critical indicators that show the number of shares or contracts traded over a specific period. High trading volume often indicates strong investor interest, while low volume may signal uncertainty or consolidation.
Applications of volume chart:
- Confirming price trends
- Detecting accumulation or distribution phases
- Assessing liquidity
These visual elements provide context to price movements, helping investors gauge the strength behind market trends.
Integrating Visual Elements into Business Investment Strategies

Building a Data-Driven Culture
For businesses to fully leverage data visualization, they must cultivate a data-driven culture. This involves training teams to interpret charts, dashboards, and infographics effectively. When decision-makers understand how to read visual elements, they can respond to market changes proactively.
Using Visual Elements in Financial Dashboards
Financial dashboards consolidate multiple into a single interface, offering a comprehensive view of performance metrics. Businesses can track revenue, expenses, and investment returns in real time. By customizing dashboards with relevant visual elements, organizations can align financial goals with market conditions.
Enhancing Investor Presentations
Investor presentations benefit greatly from visual elements that simplify complex data. Instead of overwhelming audiences with tables and text, businesses can use charts and infographics to tell compelling stories. These visual elements enhance credibility, engagement, and understanding.
Predictive Modeling and Visual Elements
Combining AI with Visual Elements
Artificial intelligence enhances the predictive power of visual elements by analyzing large datasets and identifying patterns that humans might miss. Machine learning algorithms can generate predictive charts that forecast stock prices, volatility, or economic indicators. When visualized effectively, these visual elements make complex models accessible to non-technical stakeholders.
Scenario Analysis Through Visual Elements
Scenario analysis uses visual elements to simulate different market conditions. Businesses can visualize best-case, worst-case, and most-likely scenarios to prepare for uncertainty. These visual elements help investors assess potential risks and rewards before making strategic decisions.
As predictive technologies continue to evolve, organizations are increasingly integrating AI-powered insights into their operations. Many of these innovations are also explored in 10 Digital Marketing Strategies for 2026 Success, where automation and intelligent analytics play a central role in future business growth.
Best Practices for Designing Effective Visual Elements

Clarity and Simplicity
The most effective visual elements are clear and easy to interpret. Overly complex charts can confuse rather than clarify. Businesses should focus on simplicity, using consistent colors, labels, and scales to ensure that visual elements communicate insights instantly.
Consistency Across Platforms
Maintaining consistency in visual elements across reports, dashboards, and presentations reinforces brand identity and improves comprehension. Using standardized templates ensures that all stakeholders interpret data uniformly.
Interactive Visual Elements
Interactive visual elements allow users to explore data dynamically. Features like zooming, filtering, and tooltips enhance engagement and understanding. Businesses can use interactive dashboards to empower investors to analyze data from multiple perspectives.
Case Studies: Businesses Using Visual Elements to Predict Trends

Case Study 1: TechCorp’s Market Forecasting Dashboard
TechCorp implemented a suite of visual elements to monitor global technology trends. By integrating line charts, heat maps, and moving averages, the company identified early signals of market shifts. These visual elements enabled TechCorp to adjust its investment strategy, resulting in a 15% increase in portfolio returns.
Case Study 2: FinEdge’s Predictive Analytics Platform
FinEdge developed an AI-powered platform that displayed predictive models using scatter plots and regression charts. These visual elements helped clients anticipate market corrections and optimize asset allocation. The platform’s intuitive visual elements improved client satisfaction and retention.
Case Study 3: GreenInvest’s Sustainable Portfolio Insights
GreenInvest used dashboards to track ESG (Environmental, Social, and Governance) metrics across its portfolio. Visualizations highlighted sustainability performance, guiding investment decisions toward greener assets. These visual elements reinforced the company’s commitment to responsible investing.
Advanced Applications of Visual Elements in Modern Investing
Real-Time Market Monitoring
Modern trading platforms now integrate visual elements that update in real time. These dashboards allow investors to monitor live price movements, volume spikes, and sentiment indicators. Businesses can use these tools to react instantly to market changes, reducing risk exposure and capitalizing on emerging opportunities.
Sentiment Analysis Visualization
Social media and news sentiment can significantly influence market behavior. By using tools such as word clouds, sentiment bars, and trend lines, businesses can visualize public opinion and its correlation with stock performance. These visual elements help investors understand how emotions drive market volatility.
Risk Management Through Visual Elements
Risk management frameworks benefit from dashboards that display exposure levels, diversification ratios, and value-at-risk metrics. By displaying these factors, businesses can identify vulnerabilities and adjust their portfolios accordingly. These visual elements transform abstract risk data into actionable insights.
Multi-Asset Correlation Mapping
Investors managing diversified portfolios use correlation matrices to understand how different assets interact. These visual elements reveal whether assets move together or in opposite directions, helping businesses optimize diversification strategies and reduce systemic risk.
Expanding the Role of Visual Elements in Strategic Decision-Making
Visual Elements in Economic Forecasting
Economists and analysts use charts and graphs to forecast GDP growth, inflation, and employment trends. Time-series charts and regression models visualize how macroeconomic indicators evolve. These visual elements allow businesses to anticipate policy changes and adjust investment strategies accordingly.
Visual Elements in Behavioral Finance
Behavioral finance explores how psychological factors influence investment decisions. Tools such as emotion heat maps and decision trees can illustrate how fear, greed, or overconfidence affect market behavior. Businesses can use these visual elements to design strategies that mitigate cognitive biases.
Visual Elements in Algorithmic Trading
Algorithmic trading systems rely on dashboards to display algorithm performance, backtesting results, and trade execution metrics. These displays help traders fine-tune algorithms, monitor latency, and ensure compliance with trading regulations.
Visual Elements in Portfolio Optimization
Portfolio optimization tools use efficient frontier graphs and risk-return scatter plots to help investors balance risk and reward. These visual elements make complex optimization models more intuitive, enabling better asset allocation decisions.
The Future of Visual Elements in Investment Analysis

Integration with Real-Time Data
The next generation of dashboards will integrate real-time data streams, enabling instant market analysis. Businesses will use live dashboards that update automatically, providing continuous insights into market movements.
Augmented Reality and 3D Visual Elements
Emerging technologies like augmented reality (AR) will transform how investors interact with data. 3D charts and immersive dashboards will allow users to explore data spatially, enhancing comprehension and engagement.
Ethical Data Visualization
As data visualization becomes more influential, ethical considerations will gain importance. Businesses must ensure that charts accurately represent data without distortion or bias. Transparency in reporting builds trust among investors and stakeholders.
Blockchain and Visual Transparency
Blockchain technology can enhance the reliability of visual elements by ensuring data integrity. When financial data is verified through blockchain, charts derived from it become more trustworthy. This integration will redefine transparency in investment reporting. As organizations adopt technologies that improve data reliability and transparency, trust becomes an increasingly valuable business asset. Companies seeking to strengthen their reputation can also explore The Importance of Branding in Digital Marketing to understand how credibility influences customer perception and loyalty.
Emerging Trends in Visual Elements for Business Intelligence

Integration with Cloud-Based Analytics
Cloud computing has made it easier for businesses to deploy dashboards across global teams. Cloud-based dashboards allow real-time collaboration, ensuring that decision-makers access the same visual insights simultaneously. These tools enhance agility and responsiveness in investment management
Mobile-First Visualization
With the rise of mobile trading and analytics apps, visual elements are being optimized for smaller screens. Simplified, responsive charts ensure that investors can interpret data effectively on smartphones and tablets. Mobile-friendly dashboards are now essential for modern financial communication.
Storytelling Through Visual Elements
Data storytelling combines narrative with charts and graphs to make financial insights more relatable. Businesses use interactive dashboards that guide viewers through data-driven narratives, connecting numbers with strategic outcomes. These narratives transform analytics into persuasive communication tools.
Visual Elements and Sustainability Reporting
Sustainability metrics are increasingly visualized through carbon footprint charts, renewable energy usage graphs, and ESG scorecards. These metrics help investors align portfolios with ethical and environmental goals, reinforcing corporate responsibility.
Visual Elements for Investing: The Complete Guide for Businesses – FAQ
1. What are visual elements in investing?
Visual elements are charts, graphs, infographics, dashboards, icons, and other visual tools used to present financial data, investment performance, market trends, and business insights in an easy-to-understand format.
2. Why are visual elements important for investment communication?
Visuals simplify complex financial information, improve audience understanding, increase engagement, and help investors make informed decisions more quickly.
3. What types of visual elements are commonly used in investing?
Common visual elements include:
- Line charts
- Bar charts
- Pie charts
- Candlestick charts
- Heat maps
- Infographics
- Financial dashboards
- Performance comparison tables
4. How do charts help investors?
Charts reveal trends, patterns, and market movements that may be difficult to identify in raw numerical data. They help investors analyze performance and make strategic decisions.
5. Which chart type is best for showing investment growth over time?
Line charts are typically the most effective way to display portfolio growth, stock performance, or revenue trends over a specific period.
6. What is a candlestick chart?
A candlestick chart displays an asset’s opening, closing, highest, and lowest prices during a specific time period and is widely used in technical analysis.
7. How can businesses use infographics for investing content?
Businesses can use infographics to explain investment strategies, market trends, risk management concepts, financial planning, and performance results in a visually engaging format.
8. What makes an investment infographic effective?
An effective infographic should:
- Present accurate data
- Use clear visual hierarchy
- Include concise text
- Highlight key insights
- Maintain a professional design
Conclusion
Visual elements are revolutionizing how businesses and investors analyze, interpret, and predict market trends. From line charts to heat maps, these tools transform complex financial data into clear, actionable insights. By mastering the use of visual elements, businesses can enhance decision-making, improve communication, and gain a competitive edge in the marketplace.
The future of investment analysis lies in the intelligent integration of visual elements with predictive analytics, artificial intelligence, and real-time data. As markets evolve, those who harness the power of visual elements will be best positioned to anticipate change, mitigate risk, and seize emerging opportunities.